Updated Sunday, February 21st
Description:
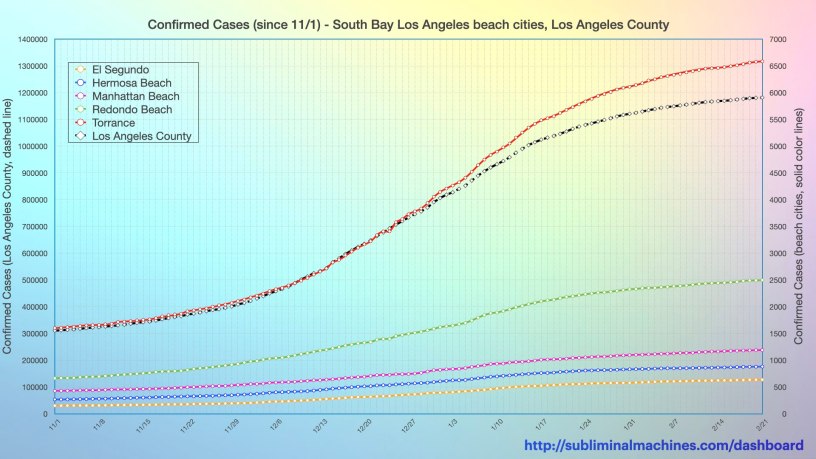
This chart shows the cumulative number of confirmed cases of COVID-19 for each of the beach cities in South Bay Los Angeles (solid coloured lines) as well as Los Angeles County in total (dark grey dashed line). Note that the latter is vertically scaled with the numbers shown on the left y-axis. The lines for the individual cities are shown vertically scaled with the numbers shown on the right y-axis.
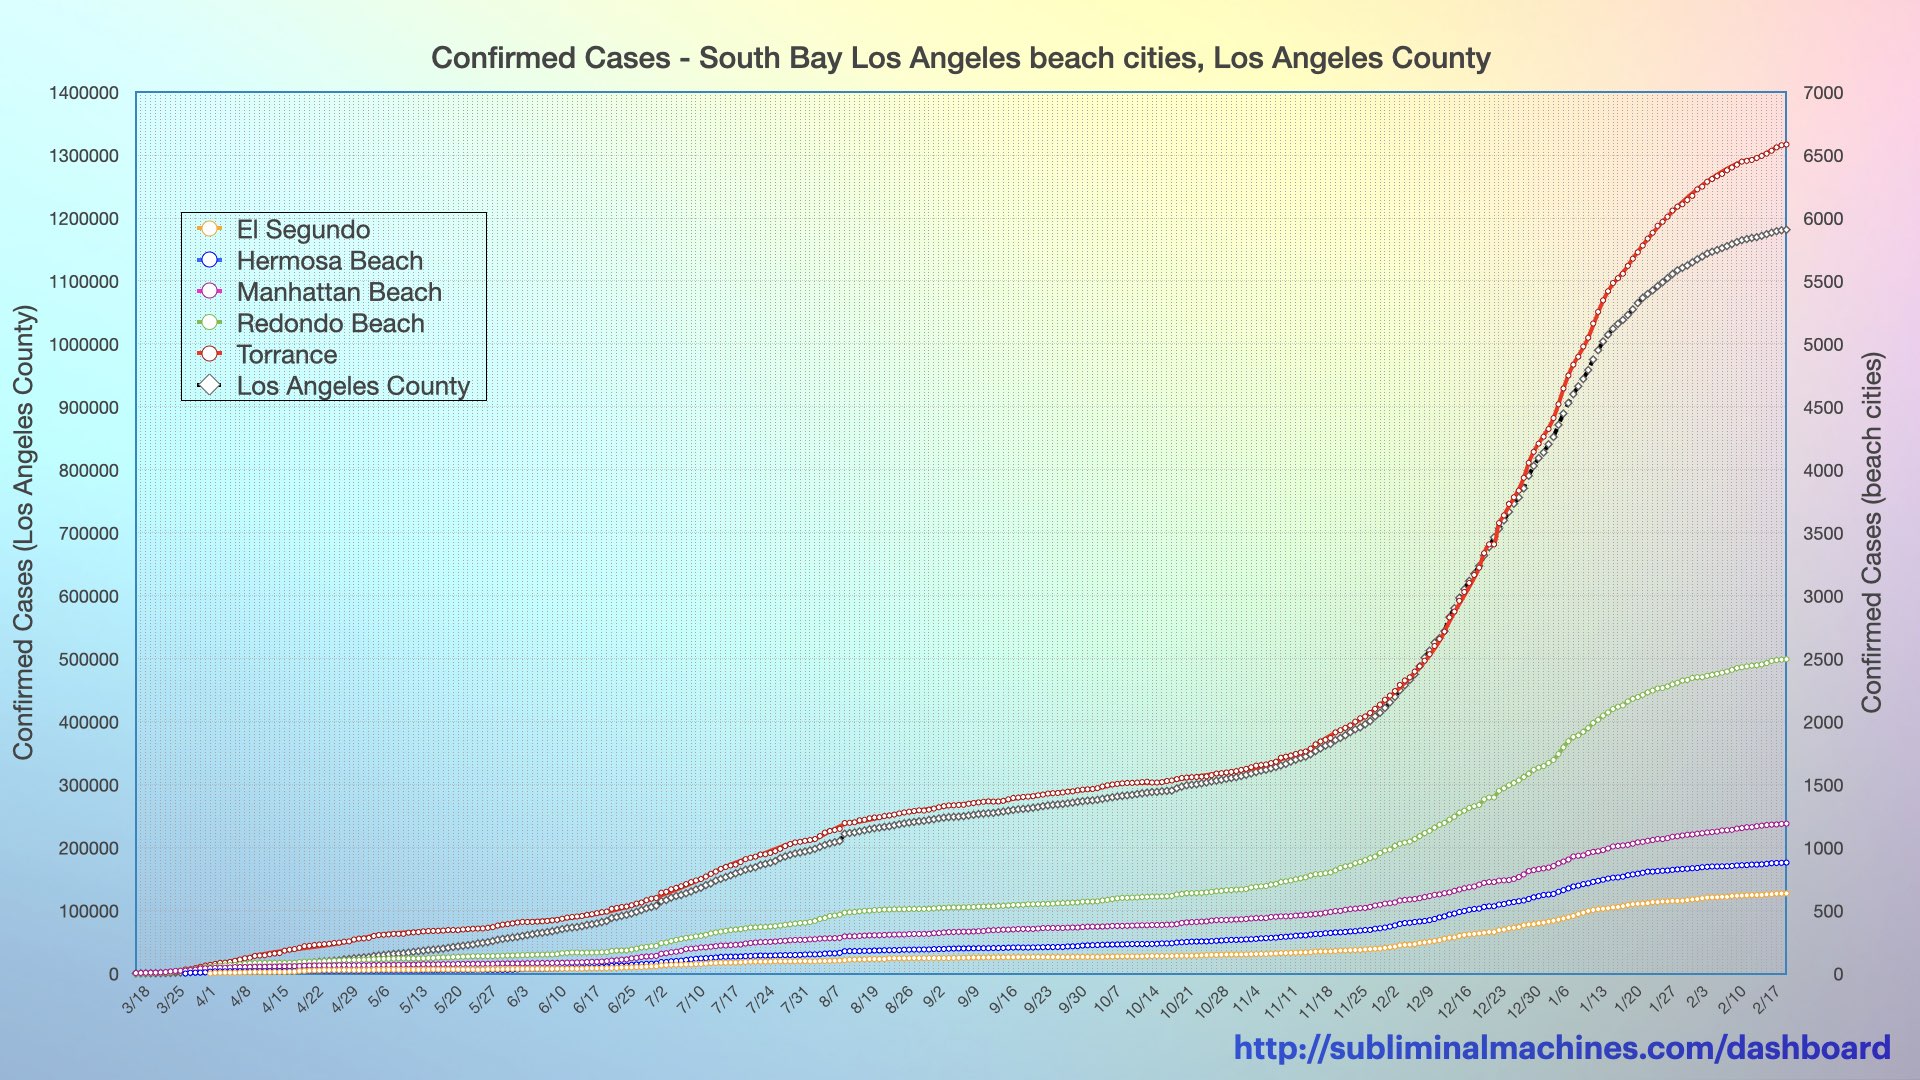
The chart featured on this page above covers just the dates from July 1st forward for purposes of clarity. If you prefer, the full (perhaps less legible but complete) chart from approximately mid-March is below.
Commentary:
You can see the evolution of confirmed cases in each of these beach cities on this chart. Through the spring and into summer, El Segundo, Hermosa Beach and Manhattan Beach were stable and doing well for the most part as visually evidenced on the chart. These cities had been managing to go up to several days without recording any new confirmed cases and mostly only plus one (sometimes two) when they did increase. Redondo Beach was doing a little less well but still managing to limit new confirmed cases to just one or two per day. Torrance (red line) was the outlier adding a few to several (or more) new confirmed cases each day.
As the lockdown restrictions eased in the summer, the increases in cases began to angle up, most steeply in Torrance (proportionally mirroring the increases of Los Angeles County as a whole). Both the mid-summer and fall surges in cases can be readily discerned as the periods of sharper inclinations in the curves.
see more…
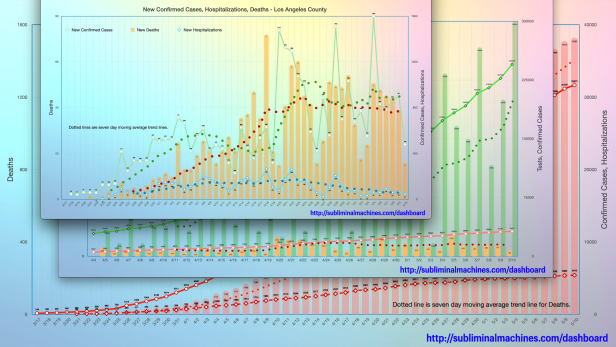
See more charts for Los Angeles County showing Testing, Confirmed Cases, Hospitalizations and Deaths for the county as a whole.

More charts showing demographics distributions by Age Group, Underlying Conditions, Ethnicity, Income and Gender for Los Angeles County as a whole.
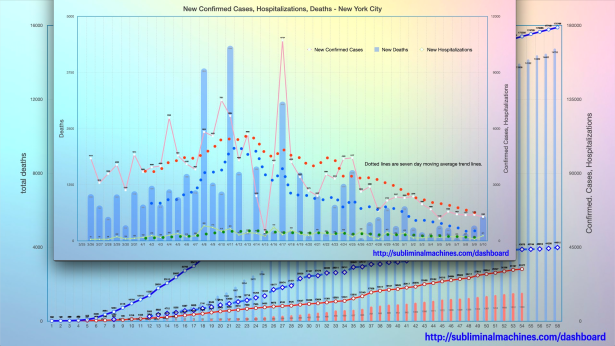
How is Los Angeles County doing relative to New York City? See the comparison charts between Los Angeles County and New York City.

Wonder why my city redondo
Is higher than other beach cities
S Redondo has a lot of high rise blogs
Like my native Brooklyn and north
Redondo NoRed… does not so perhaps that is the case
LikeLike
hello Solomons, thanks for writing. while there are more cases in Redondo than the other beach cities when you factor in their relative population size, it actually has a smaller percentage of its population tested positive than Manhattan Beach. please refer to the bubble chart maps on the right side. those circle areas are plotted normalized to 100,000 people for purposes of comparison.
LikeLike
Any guess as to why torrance is climbing faster than neighboring cities?
LikeLike