Updated thru Sunday, June 28th

Chart of cumulative Confirmed Cases, Hospitalizations and Deaths (columns) for New York City (blue colours). Confirmed Cases and Deaths (columns) for L.A. County (orange colours) are shown for relative comparison.
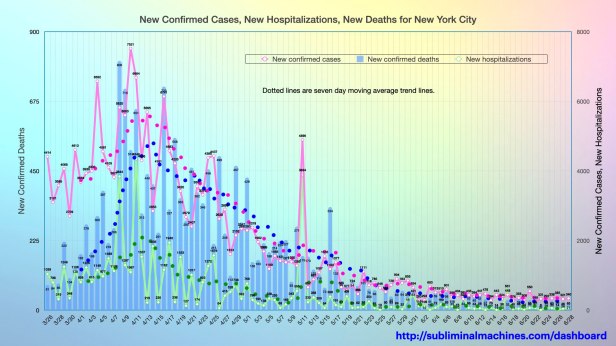
Chart of daily new Confirmed Cases, Hospitalizations and Deaths (columns) for New York City. Trendlines (dotted lines) are seven day moving averages. Read more.

Chart of daily new Deaths (columns) for New York City (Confirmed, light blue) and Los Angeles County (light orange). Trend lines (blue, orange dotted lines, respectively) are seven day moving averages.
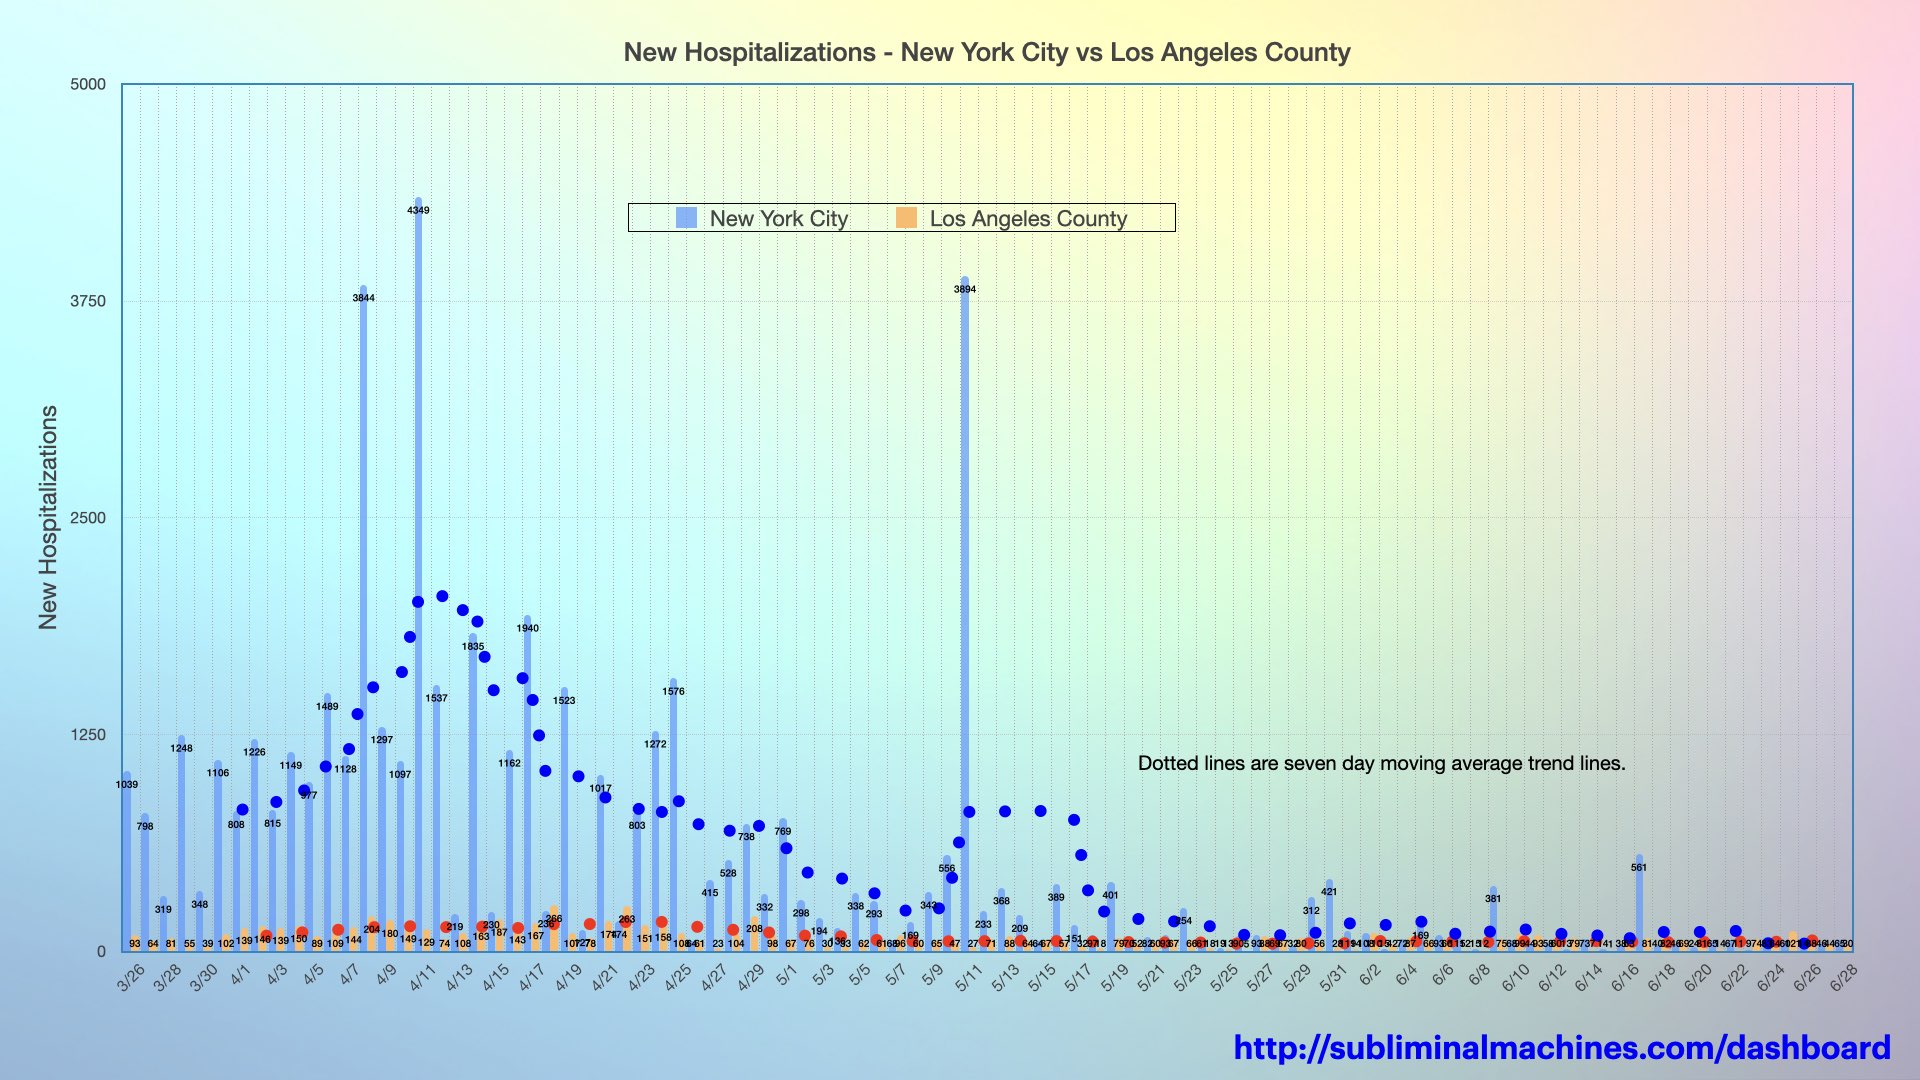
Chart of daily new Hospitalizations (columns) for New York City (light blue) and Los Angeles County (light orange). Trend lines (blue, orange dotted lines, respectively) are seven day moving averages.

Chart of daily new Confirmed Cases (columns) for New York City (light blue) and Los Angeles County (light orange). Trend lines (blue, orange dotted lines, respectively) are seven day moving averages.
see more…
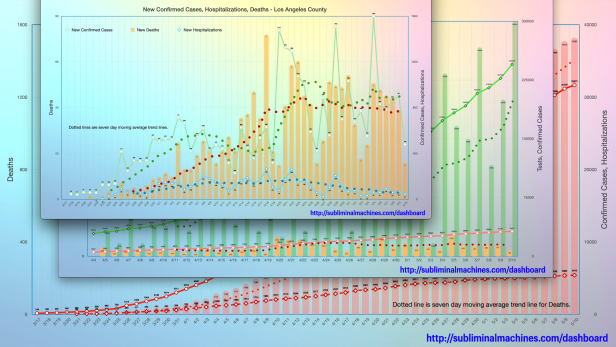
See charts for Los Angeles County showing Testing, Confirmed Cases, Hospitalizations and Deaths for the county as a whole.
return to main dashboard
Thanks for looking.
Check back tomorrow
for the latest updates.
Get in Touch…
You can send Subliminal Machines a private message by selecting Contact in the menu at the top of this page or just post a comment below.
Copyright Subliminal Machines – All rights reserved
